In the three months ending in April 2026, Central Simi Valley saw its median sale price slip 3 percent from a year earlier, even as the number of homes changing hands there jumped by roughly a third. Across town, in the hillside tracts and view lots that make up East Simi Valley, the opposite happened. Fewer homes sold than the year before, and the ones that did close sold for over 10 percent more.
That is not two separate housing markets responding to two separate economies. It is one city, one set of interest rates, one commute corridor into the San Fernando Valley, producing prices that moved in opposite directions because the supply of homes moved in opposite directions first. A buyer or seller looking at a single citywide median for Simi Valley this spring was looking at an average of two things that were not actually converging. They were pulling apart.
Two Neighborhoods, Two Directions, Same Three Months
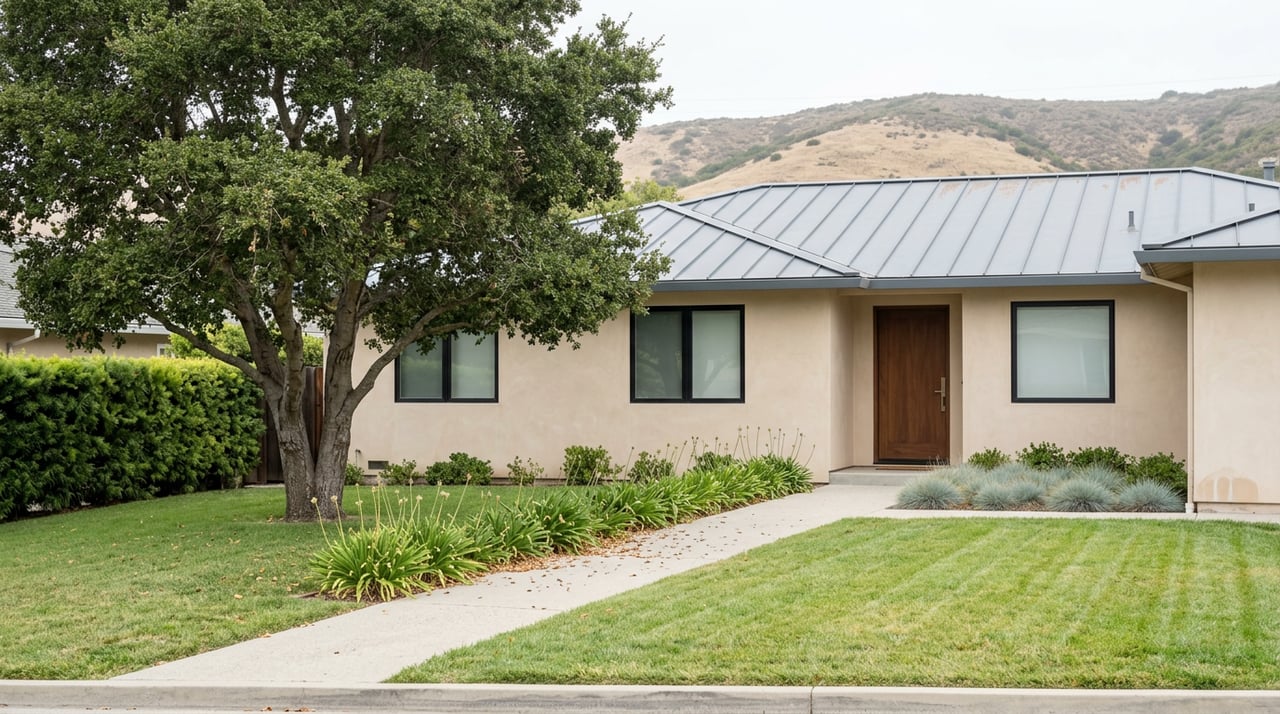
Central Simi Valley is the older, flatter part of the city, built out through the 1960s and 1970s around what is now the historic core and the Arroyo Simi path. It is dense with comparable ranch-style tract homes, which is part of why so many of them can trade in a given quarter. In the three months ending in April 2026, 95 homes sold there, up from 72 over the same stretch the year before. That is a lot more supply clearing at once, and the median price came in at $825,000, down 3 percent year over year. Price per square foot fell even harder, down 10.8 percent to $462. Homes there also sat longer, an average of 42 days on market compared to 36 days the year before.
East Simi Valley tells a different story. This is the hillside side of the city, home to Wood Ranch and the newer view-lot tracts backing up to Corriganville Park and the trailheads that climb toward Rocky Peak. Fewer of these homes exist in the first place, and fewer of them turned over this spring: 51 sales in the three months ending in April 2026, down from 54 the year before. But the median for those sales climbed to $835,000, up 10.6 percent year over year, and the average sale price for the single month of April 2026 hit $840,000, up 18.3 percent from the year before. Price per square foot in East Simi Valley actually fell too, down 9.08 percent to $475, and homes there took an average of 46 days to sell, longer than Central Simi Valley's 42 despite the stronger price growth.
Here is the comparison side by side, all figures for the three months ending in April 2026 unless noted:
| Central Simi Valley | East Simi Valley | |
|---|---|---|
| Median sale price | $825,000 (down 3.0% YoY) | $835,000 (up 10.6% YoY) |
| Price per square foot | $462 (down 10.8% YoY) | $475 (down 9.08% YoY) |
| Average days on market | 42 (up from 36) | 46 (down from 49) |
| Homes sold, April 2026 | 95 (up from 72) | 51 (down from 54) |
Neither half of the city is behaving the way its own price-per-square-foot number would predict. That is the part worth sitting with.
The Mechanism Is Volume, Not Just Location
The instinct when a market cools in one neighborhood and heats up in another is to assume something about the neighborhoods themselves changed. Schools, commute times, a new restaurant corridor, whatever story fits. Sometimes that is true. But the cleanest explanation sitting in this data is simpler and less romantic. Central Simi Valley had a third more transactions clear in the same window, and prices there softened. East Simi Valley had fewer transactions clear, and prices there rose. That is supply and demand doing exactly what the textbook says, just at a scale small enough that most people never notice it happening inside a single city.
More listings moving through Central Simi Valley's flatter, more fungible tract stock gave buyers more to compare against, and comparison shopping pushes prices toward whatever the middle of that stock will bear, which this spring was a little lower than last spring. Fewer listings moving through East Simi Valley's hillside lots meant the buyers who wanted that specific kind of home, view lot, larger parcel, proximity to the trail system, were bidding against a smaller pool of alternatives, and prices there got bid up even as the number of sales fell.
The lesson is not that East Simi Valley is simply the better market and Central Simi Valley the weaker one. It is that transaction volume and price direction do not move together the way most buyers assume. A neighborhood with more sales closing is not automatically a hotter neighborhood. Sometimes it means the opposite: enough supply is finally moving through that prices have room to settle.
The Price-Per-Square-Foot Puzzle Neither Half Explains
The citywide figure for Simi Valley, drawn from the same source over the three months ending in May 2026, put the median sale price at $849,000, essentially flat year over year, down just 0.06 percent. But price per square foot citywide was reported up 5.8 percent to $508.
That number should not be possible if you only look at the two halves that make it up. Central Simi Valley's price per square foot fell 10.8 percent. East Simi Valley's fell 9.08 percent. Both pieces of the city got cheaper per square foot. The whole got more expensive per square foot. That is not a rounding error, and it is not one source contradicting another, since all three figures come from the same data provider looking at the same market from three different zoom levels.
The most likely explanation is a shift in what kind of home closed escrow rather than what any individual home was worth. If larger single-family homes made up a bigger share of citywide sales this spring than they did in the neighborhood-level breakdowns, or if condos and smaller units pulled back from the mix, the blended price-per-square-foot figure can rise even while every actual property type inside it is getting cheaper to buy per foot. It is worth saying plainly that the portals do not publish the underlying property mix, so this is the most consistent read of what is visible, not a certainty.
Other citywide trackers landed close to Redfin's number for the same general period. Zillow put the average home value at $848,843, down 1.5 percent over the past year. One market report cited a median of $850,000, down 0.35 percent, with homes selling in 43 days and 40 percent of sales closing above asking price. Another put the citywide figure closer to $815,000 for homes that closed in May 2026. These are all within about $35,000 of each other, which by real estate standards counts as agreement. But that agreement is exactly the problem. A citywide number all the trackers can live with is still erasing a double-digit swing happening between two halves of the same city in the same three months.
What This Means If You're Comparing Simi Valley to Somewhere Else
If you are budgeting off a citywide median for Simi Valley, whichever version you found, you are budgeting off a number that neither Central Simi Valley nor East Simi Valley actually produced this spring. Ask which submarket the comps came from before you anchor to a price.
If you are selling an older tract home near the historic core or along the flatter stretches west of the hills, price with the reality that similar homes are taking longer to move than they were a year ago, an average of 42 days instead of 36, and that a third more of them came to market at the same time you are trying to sell. Competitive, realistic pricing matters more in that environment than it did twelve months ago.
If you are chasing a hillside lot near Wood Ranch or anywhere backing up to the trail system, expect to compete for a shrinking number of listings rather than a growing one. Fewer of these homes traded this spring, not more, and the ones that did sell went for meaningfully more than the year before. A longer average time on market, 46 days, does not mean less competition. It can mean the right buyer is taking their time finding the specific lot they want and is willing to pay for it once they do.
Either way, the citywide number is not going to tell you which situation you are actually in.
If you want to talk through what the numbers on your specific street or your specific side of the hills are actually doing right now, that is exactly the kind of conversation worth having before you set a price or make an offer. Paula Kropp offers a Schedule My Clarity Call for exactly this reason.